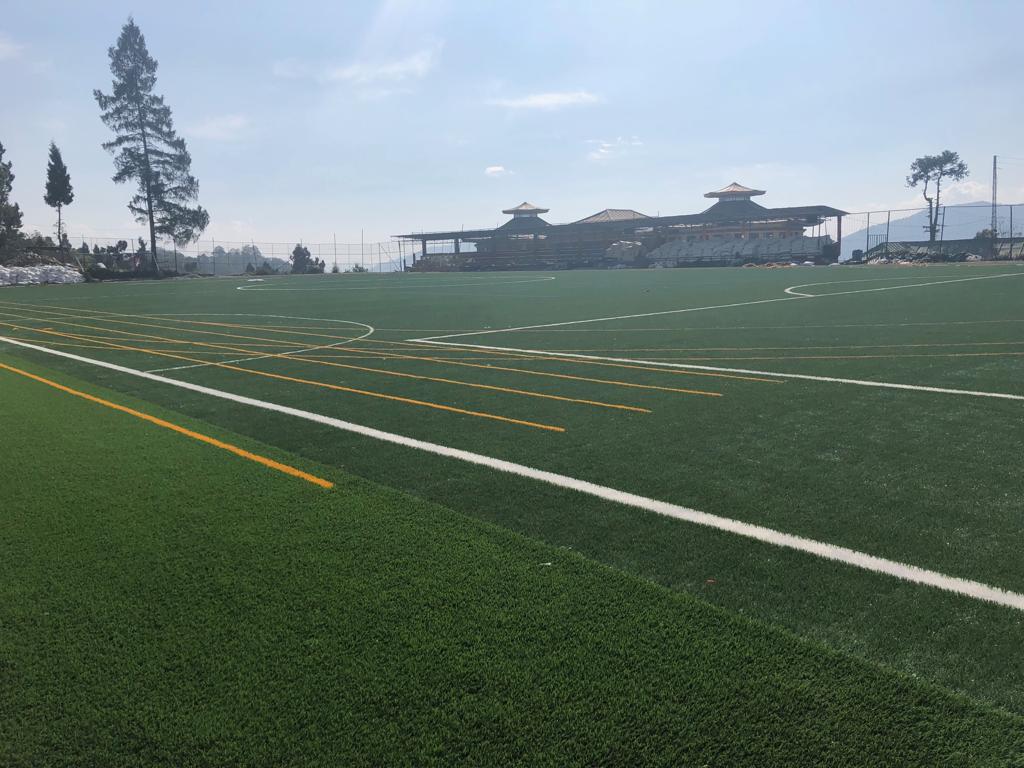
A study from Spain shows how fibers from artificial turf, typically used in sports, can contribute to plastic pollution.
Artificial turf covers the field at sporting venues across the world, with some 1,200 to 1,400 new installations across the European Union each year, according to researchers in Spain. What they’ve discovered is that the plastic fibers on the pitch, from which the turf is made, are a significant source of microplastic pollution in the marine environment.
The turf fibers are made of polyethylene (PE) and polypropylene (PP), and to a lesser extent polyamide, according to research published in the October 2023 issue of Environmental Pollution. They’re held together by other materials, including recycled styrene-butadiene rubber from vehicle tires. And while they’re common in sports venues, the turf fibers are now used to create artificial lawns in playgrounds, private lawns, and other landscaping projects.
What researchers from the University of Cadiz and the University of Barcelona wanted to know was just how significant the artificial fibers have become in contributing to plastic pollution. So they took a total of 417 water samples, collected from June 2014 through July 2021 at two sites.
One sampling site was on the Mediterranean Sea surface off of Catalonia. The other, with two locations used for two of the study years, was on the Guadalquivir River, which flows into the Gulf of Cadiz in the Atlantic Ocean. The artificial turf fibers were differentiated from other plastics by their size, shape and color, with most of the turf fibers being green (82% of them) and the others brown, yellow or gray.
“Artifical turf fibers were found in half (50.1%) of all collected samples, with higher presence among samples from the sea surface (62.2%) than in samples from river waters (37.0%),” reported the authors, led by William P. de Haan of the marine geosciences department in Barcelona.
In some samples, the turf fibers accounted for more than 11% of the plastic content in river waters and 25% in surface waters. All told, they amounted to more than 15% of the plastic found in marine environments.
“High concentrations found off the city of Barcelona underscore metropolitan areas as main contributors to artificial turf fiber pollution,” the authors said, noting similar findings by other scientists near Tokyo, Japan, and in mainland China.
The scientists from Spain say there’s still much they don’t know about the artificial turf impacts. For example, the fibers may experience more weathering than other plastic products, like plastic bags or takeout food packaging, do before entering the environment. That’s because the fibers are exposed to wear and tear through football and other contact sports.
“They are directly exposed to sunlight, weather extremes and mechanical abrasion by the movement of people, various types of tools and objects, or machinery,” the authors explained. “For this reason, it is not known exactly whether artificial turf fibers in our samples would have weathered during the operational life of artificial turf or after their leakage into the aquatic environment.”
Research suggests that up to 10% of fibers might be lost from a sports field each year, and an estimated 16% of these fibers find their way into storm drains and runoff. The impact matters because artificial turf has been in use for 60 years now, generating plastic pollution that’s been overlooked in considering climate, biodiversity loss and other problems, as well as the solutions.
“How many artificial turf fibers can further accumulate on riverbanks, beaches, seabed and riverbed sediments is still completely unknown,” the authors conclude. “We anticipate that this study will inspire future efforts to reduce the release and impacts of artificial turfs in the environment.”
This story first appeared on Sustainability Times
© 2023 Sustainability Times.
This article is licensed under a Creative Commons Attribution-ShareAlike 4.0 SA International License.


